I have survey needs, but no budget to hire a surveyor. Nor to buy survey equipment. I do have a computer and Internet access.
Enter the Missouri Spatial Data Information Service (MSDIS) which provides LiDAR data in a County-wide Digital Elevation Model (DEM) format for all Missouri Counties- available for free! And also QGIS, an open-source Geographical Information System (GIS) application – available for free!
With these free tools, I’m in business. I can get elevation data, query that data to find cross-sections, stream profiles, and similar data for use in other software. Like the Federal Highway Administrations HY-8 Culvert Design software – available for free! With a couple of caveats.
MSDIS DEM formats
The DEM files available from MSDIS are in a proprietary ESRI GeoDatabase format which requires ARCMap or equivalent to open. MSDIS is in the process of converting the DEM files to a zipped TIF file to make them available without use of ESRI products. In the meantime, if you have access to ArcMAP, great. If not, find someone who does or wait until MSDIS gets your county converted to the TIF/ZIP format.
As a side note, it’s important to know that the DEM is an image file, in TIF format. Each pixel in the file represents one square unit with the pixel color representing the elevation. Once you have the TIF file from MSDIS, you’ll discover the data is in meters. Each pixel is one square meter, and the elevation/color values are also in meters.
QGIS will handle the X/Y conversions for you, assuming your QGIS project is using an appropriate Coordinate Reference System (CRS), but the elevations will need to be converted from meters to feet if you want measurements in feet. We’ll get to that in a minute.
First, make sure QGIS is set up correctly. Check the Project Properties CRS tab (from the Project Menu) and set a CRS that is in feet. I use a Missouri State Plane Coordinate system (ESRI:102697 – NAD_1983_StatePlane_Missouri_Central_FIPS_2402_Feet – Projected.) Using this CRS for my project keeps all my distance measurements in feet.
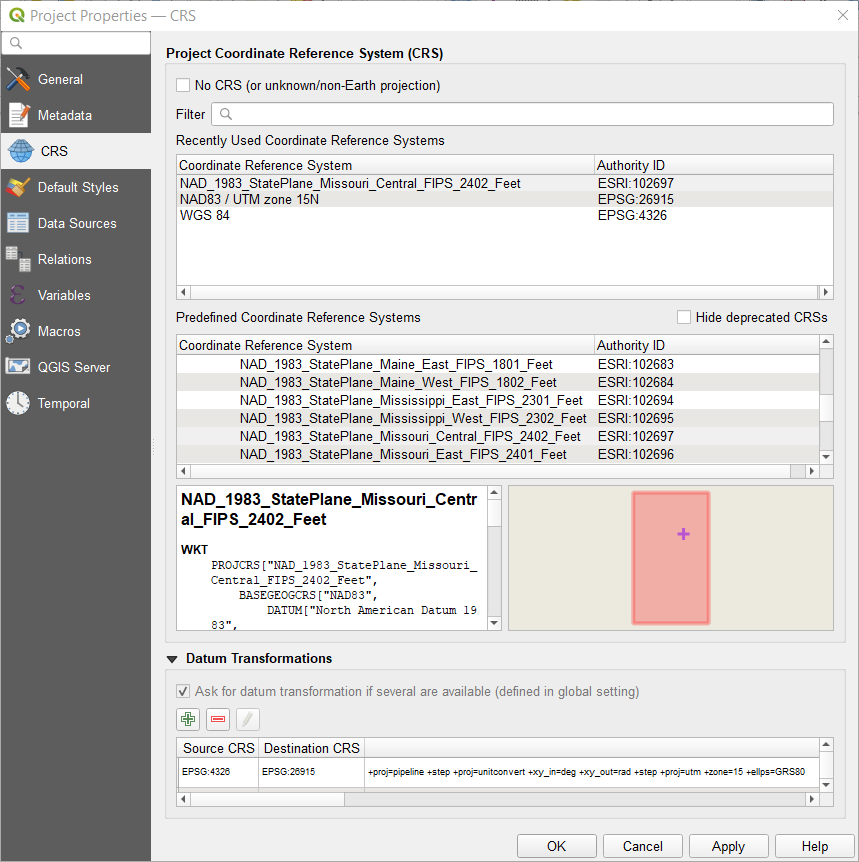
You can setup QGIS to use the project CRS or any other CRS for new files you create – be careful of the CRS for each file – I choose to use the project CRS to keep everything consistent.
The DEM data in TIF format from MSDIS is in a different CRS: EPSG:26915 – NAD83 / UTM zone 15N – Projected. Again, QGIS will handle that “on the fly” and allow you to use the data even though your project is in a different CRS. But we will have to convert the elevations from meters to feet.
Using a DEM in QGIS
The first step is to bring the DEM data layer into your QGIS project. Use the Browser panel to browse to the location your DEM file is stored, then double-click to add it to your project. Once you have the layer, select it in the layers panel, then use the Raster Calculator from the Raster menu to convert the elevations.

In the Raster Calculator, double-click on the DEM layer to add it’s value to the calculation box. Then add * 3.2800399 to the calculation – this is the conversion factor for meters to feet.
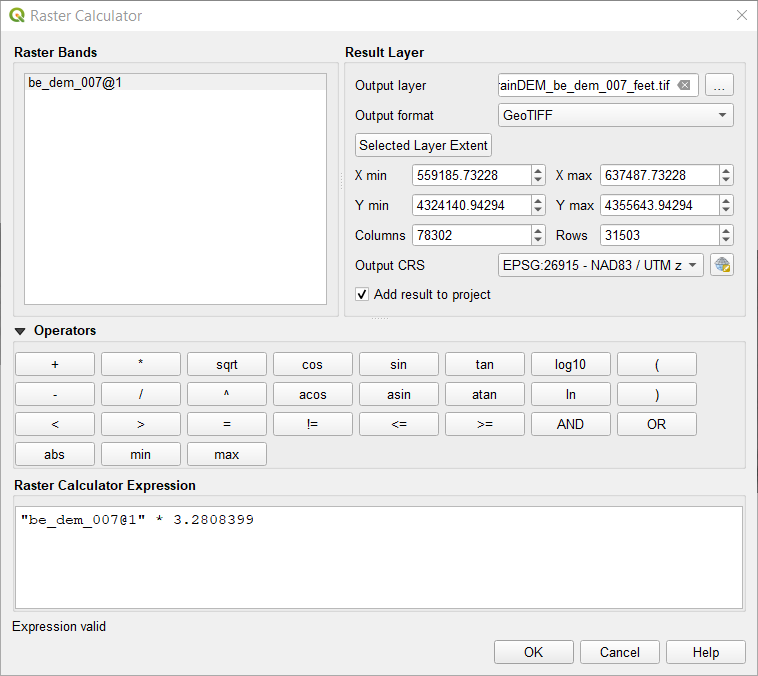
You will also need to tell QGIS what to do with the output. We want to store it in a new TIF file for future use, so use the Output Layer field to create a new file/location and make sure Output is set to GeoTIFF. With those two steps done, you can press OK to begin the conversion process. It will likely take a while if you’re converting an entire county-wide DEM. If you checked the Add to Project checkbox, the new layer will be added to the layers list. (If not, don’t worry – it’s saved where ever you told QGIS to save it and you can add it manually.)
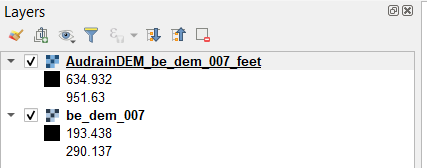
Congratulations! You now have a Digital Elevation Model of an entire county in the correct elevation units. Notice the different ranges shown on the two layers above – the original in meters and the new one in feet. I kept the original file name in the new file name but added info for my future reference.
Now, what can we do with it?
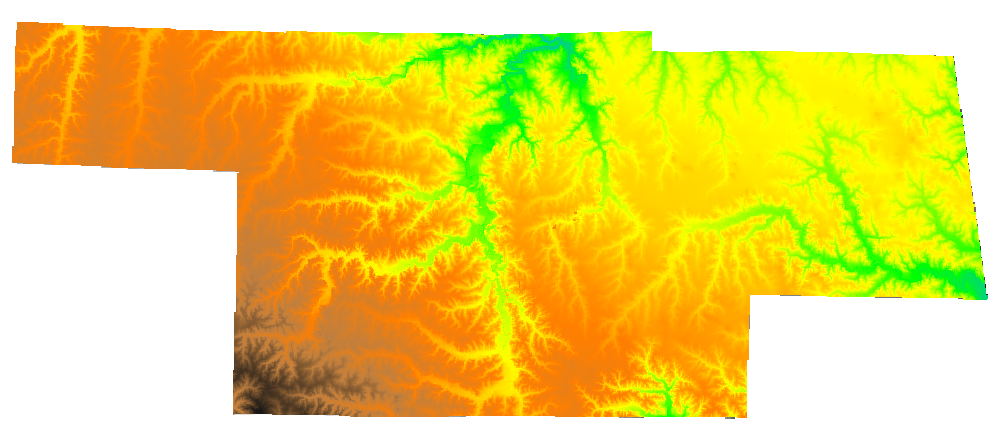
Make it pretty. Go to the layer properties (right-click a layer and choose Properties from the menu) and the Symbology tab. Change the Render Type from Singleband Gray to Singleband Pseudocolor. Play around with changing the Color Ramp to different colors. Check out the All Color Ramps option.
My preferred Color Ramp is the Topography-elevation ramp. To get there, choose Create New Color Ramp and then cpt-city from the drop-down list in the dialog. Choose elevation from the Topography color ramps. Click the classify button to assign the ramp to elevations in your DEM.
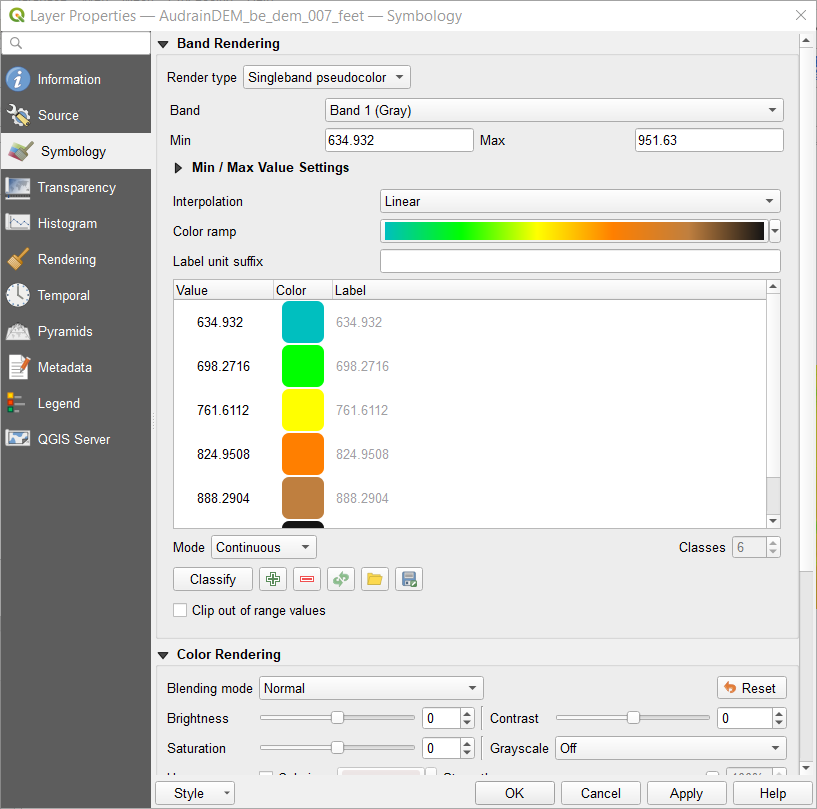
You should end up with something like this:
Plug it in to get Profiles
Just making pretty colors isn’t enough, though. We can get elevations and, even better, cross-sections. There are a number of plugins that extend QGIS capabilities, and one of the most useful for me is called Profile Tool.
Plugins are installed to QGIS through the Plugins menu. Choose Manage and Install Plugins, search for “Profile” and select Profile Tool. Install the plugin and a new toolbar icon appears: ![]()
Now this is where the fun begins! Tap the Profile Tool icon and a new panel appears. Select your DEM layer in the layers panel, then click the Add Layer button to tell the Profile Tool which layer(s) you want to use. “Temporary Polyline” is the default selection – you can click two (or more) ends of line segments on the DEM display (double-click when finished drawing the line) to get an elevation profile along that line. Right-click to cancel the line and start over.
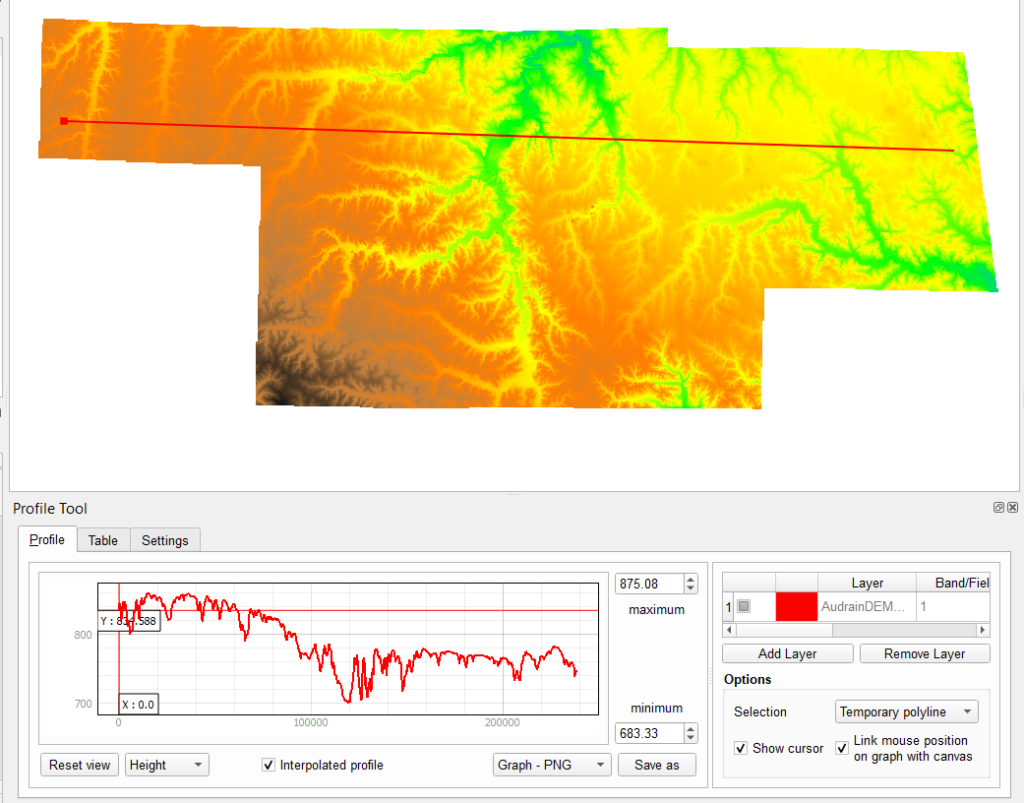
Moving the mouse cursor across the profile plot will show a moving red dot on the DEM/polyline. The Selected Polyline option will use line layers from your QGIS drawing as the line for the profile. This allows creation of profiles along roads, arbitrary lines (think stream cross-sections and streambed profiles).
Finally, changing from the Profile tab to the Table tab reveals an option to copy the profile to the clipboard. The profile can be pasted into Excel or other software for further processing.
Limitations
Obviously, using the LiDAR DEM data is not a true substitute for actual field-acquired survey data. But, for some purposes, I find it sufficient.
For example, I use the data as a basis for performing hydraulic calculations for designing culvert replacements. Combined with some simple field measurements such as culvert size and elevation difference between the culvert inverts and roadway centerline, the DEM topographic information gives enough information that I’m comfortable comparing hydraulics for the existing structure and potential replacements.
It’s important to keep in mind the DEM resolution is 1 meter by 1 meter. And that LiDAR doesn’t work below water surfaces.
Watch for CRS pitfalls: The DEM remains in meters in the XY dimension – only the elevations were converted with the Raster Calculator. The QGIS project needs to be in a CRS that uses feet to get profiles in feet. Alternately, the original DEM could be used with a project CRS in meters to keep everything metric.